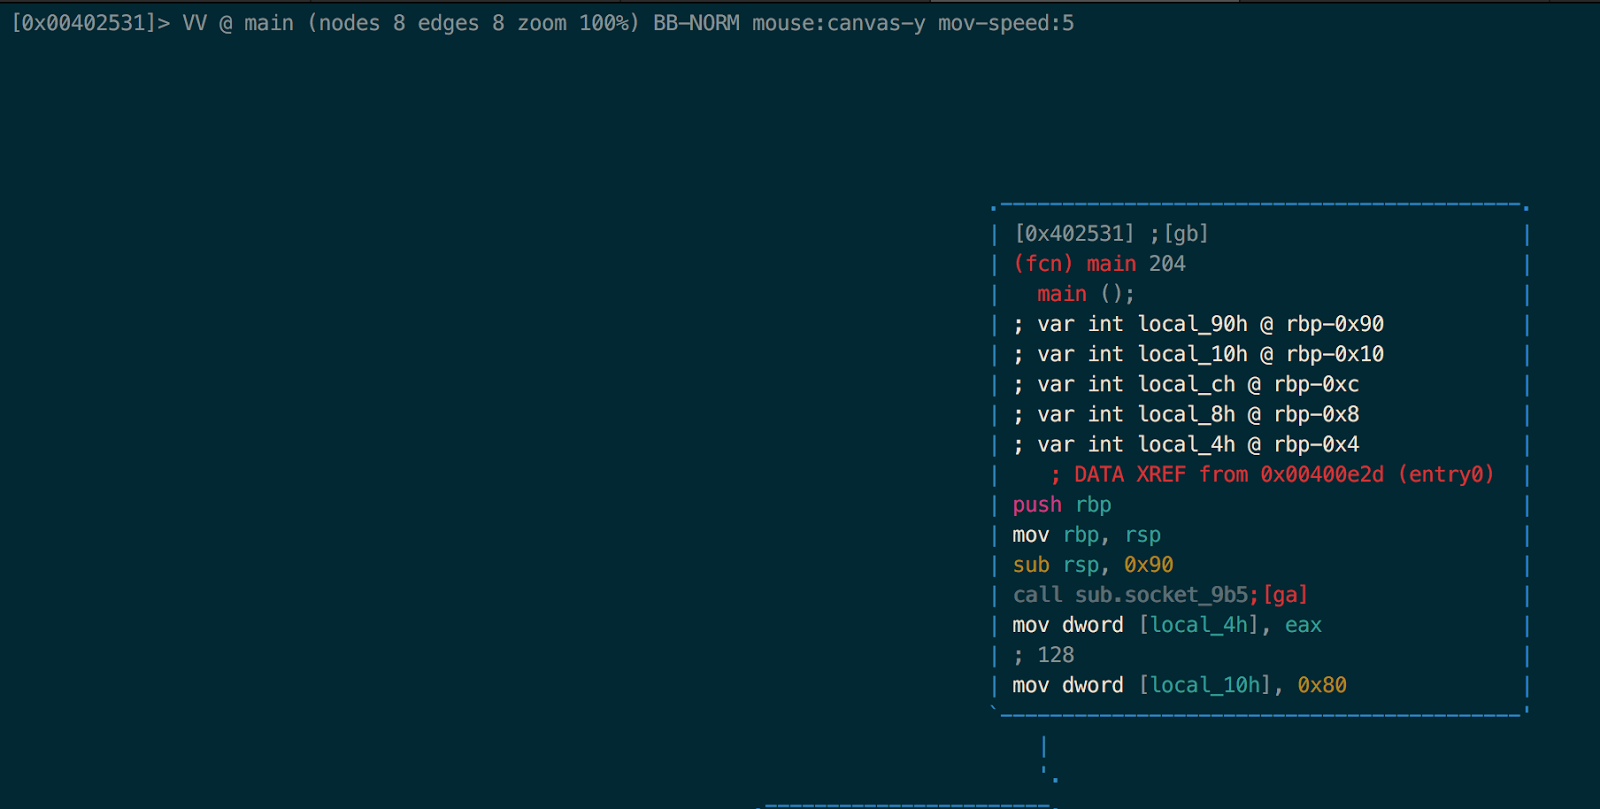
This post will show you how to debug a forking server using Radare2. It will not show how to solve this challenge though, there are probably some good write-ups out there if you know where to look.
The example program is a 150 point reversing CTF challenge from Asis Quals in 2014 and can be found here. The program is in ELF64 format and when running it, it starts a server listening on TCP 25565 as you will see from analyzing the binary.
Note that I’ve renamed the file to re_150.
file re_150
re_150: ELF 64-bit LSB  executable, x86-64, version 1 (SYSV), dynamically linked (uses shared libs), for GNU/Linux 2.6.32, BuildID[sha1]=712afba37f0d7e5a358b1cf522afd3bdaa36f16b, stripped
Assuming you have Radare2 setup on you machine, we start off by loading the binary and let r2 do analysis on it:
r2 -A ./re_150
:> VV @ main

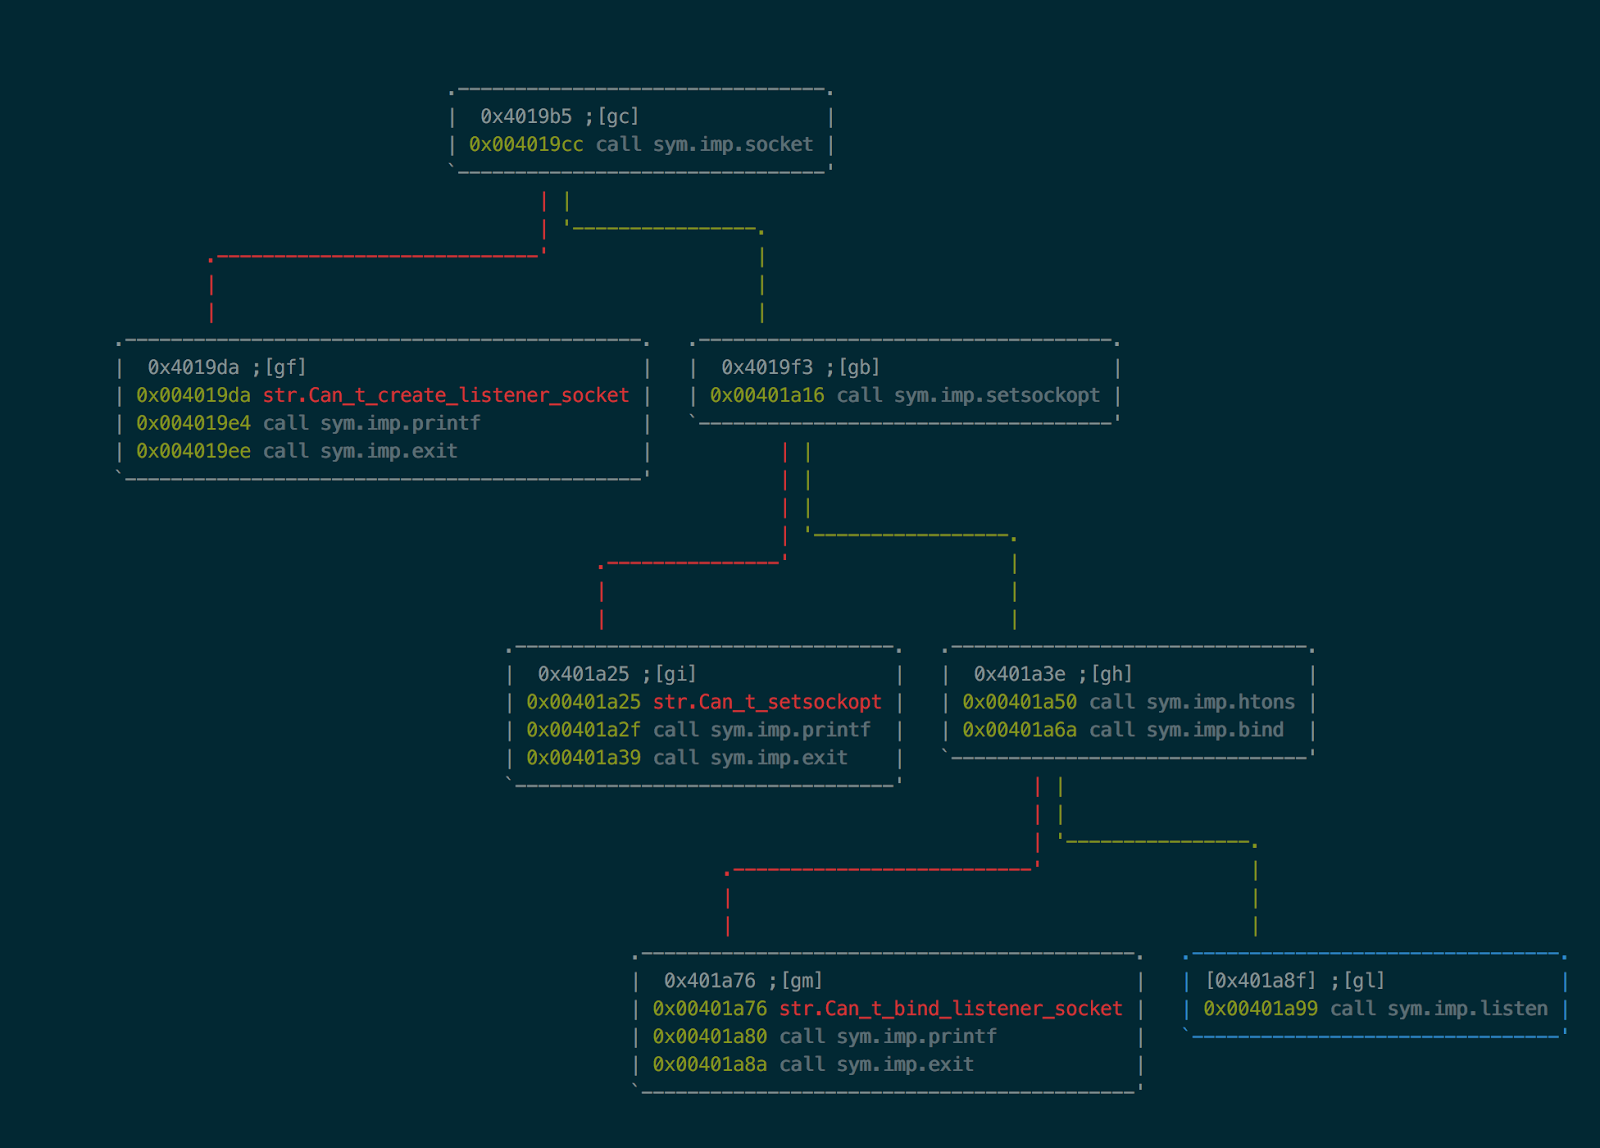
The first function we encounter is sub.socket_9b5. Let’s analyze this function in visual mode:
:> VV @ sub.socket_9b5
We can see that the this function calls socket(), bind(), and listen(). One number that stood out to me before the call to bind() was 0x63dd.

:> ? 0x63dd
25565 0x63dd 061735 25.0K 0000:03dd 25565 "\xddc" 0b0110001111011101 25565.0 25565.000000f 25565.000000 0t1022001212
So this confirms that it is this program listening on port 25565.

So next we wanna debug the program to try and find out what happens in the last and most interesting function call in the binary: sub.malloc_f9d.
Let’s kill our current session and relaunch the binary in debugging mode, and also let’s do the same analysis we did initially. This requires you to be on a linux platform that can run the ELF64 file.
It should look similar to this:
$ r2 -dA re_150
Process with PID 4734 started...
= attach 4734 4734
bin.baddr 0x00400000
Using 0x400000
asm.bits 64
[x] Analyze all flags starting with sym. and entry0 (aa)
TODO: esil-vm not initialized
[x] Analyze len bytes of instructions for references (aar)
[x] Analyze function calls (aac)
[x] Use -AA or aaaa to perform additional experimental analysis.
[x] Constructing a function name for fcn.* and sym.func.* functions (aan)
= attach 4734 4734
4734
 -- This page intentionally left blank.
[0x7f950325f260]>
The program immediately breaks and we can see where we are at by using dm to list the memory map of the current process. Mine looks like this:
0x0000000000400000 # 0x0000000000403000 - usr    12K s -r-x /home/vagrant/ctf/ASIS2014/reverse150/re_150 /home/vagrant/ctf/ASIS2014/reverse150/re_150 ; map.home_vagrant_ctf_ASIS2014_reverse150_re_150._r_x
0x0000000000603000 # 0x0000000000604000 - usr     4K s -rw- /home/vagrant/ctf/ASIS2014/reverse150/re_150 /home/vagrant/ctf/ASIS2014/reverse150/re_150 ; map.home_vagrant_ctf_ASIS2014_reverse150_re_150._rw
0x00007f950325e000 # 0x00007f9503281000 * usr   140K s -r-x /lib/x86_64-linux-gnu/ld-2.19.so /lib/x86_64-linux-gnu/ld-2.19.so ; map.lib_x86_64_linux_gnu_ld_2.19.so._r_x
0x00007f9503480000 # 0x00007f9503482000 - usr     8K s -rw- /lib/x86_64-linux-gnu/ld-2.19.so /lib/x86_64-linux-gnu/ld-2.19.so ; map.lib_x86_64_linux_gnu_ld_2.19.so._rw
0x00007f9503482000 # 0x00007f9503483000 - usr     4K s -rw- unk0 unk0
0x00007fff9bb71000 # 0x00007fff9bb92000 - usr   132K s -rw- [stack] [stack] ; map.stack_._rw
0x00007fff9bb9a000 # 0x00007fff9bb9c000 - usr     8K s -r-x [vdso] [vdso] ; map.vdso_._r_x
0xffffffffff600000 # 0xffffffffff601000 - usr     4K s -r-x [vsyscall] [vsyscall] ; map.vsyscall_._r_x
The thing to note from this is that there is a * at the memory region that we are currently executing from. We can see that we have not yet made it to our program. So let’s continue execution until we get to the program’s main method:
:> dcu main
continue until 0x00402531 using 1 bpsize
hit breakpoint at: 402531
Doing something like
:> VV
or
:> pdf
we can see that we are now in the program’s main function.
Now let’s let program run freely and let us send some data to it.
:> dc
Now the socket should be opened and listening for connections on port 25565. Run the following in another shell:
$ python -c 'print "hello"' | netcat 127.0.0.1 25565
hello
Sorry!
Sorry!
Alright we get back our own data and 2x"Sorry!".
Now let’s configure r2 to help us debug this. Let’s list all the configuration related to debugging:
:> e??~dbg
		 bin.dbginfo: Load debug information at startup if available
    dbg.aftersyscall: Stop execution before the syscall is executed (see dcs)
            dbg.args: Set the args of the program to debug
         dbg.backend: Select the debugger backend
             dbg.bep: Break on entrypoint
        dbg.bpinmaps: Force breakpoints to be inside a val
There are a few related to forks, let’s set the following two, they will be reset when restarting r2:
[0x7fca08e80260]> e dbg.follow.child = true
[0x7fca08e80260]> e dbg.forks = true
dbg.follow.child: Continue tracing the child process on fork. By default the parent process is traced
dbg.forks: Stop execution if fork() is done (see dbg.threads)
Now, restart the process, let it run freely and send it some data again:
[0x7fca08e80260]> doo
[0x7f9e89f22260]> dc

# ...meanwhile in another shell
$ python -c 'print "hello"' | netcat 127.0.0.1 25565
We should now be able to see the output of the child process:
0x7f9e89f22260]> dc
= attach 4770 4770
Waiting for clients...Accepting new clientWaiting to recieve data...
received buffer is : hello

Waiting to recieve data...
Alright, now r2 follows the child process resulting from the fork. Let’s set a breakpoint on the function we are interested in and restart execution:
:> db sub.malloc_f9d
:> doo
:> dc
If all went well the program should now be waiting for input. Let’s give it some by running the same python command as before:
python -c 'print "hello"' | netcat 127.0.0.1 25565
Now we don’t see any output since the debugger hit a breakpoint in the child process. We can confirm this by using the dp command and checking it against the Linux process list.
[0x00401f9d]> dp
Selected: 4913 4913
 * 4913 uid:0 s (current)
 - 4907 uid:1000 s (ppid)

[0x00401f9d]> !ps faux  | grep re_150
vagrant   4899  0.0  0.2  11136  1384 pts/1    S+   17:49   0:00  |           \_ /bin/bash /home/vagrant/ctf-tools/bin/r2 -dA re_150
vagrant   4900  0.0  3.0 101516 15296 pts/1    S+   17:49   0:00  |               \_ /home/vagrant/ctf-tools/radare2/bin/radare2.real -dA re_150
vagrant   4907  0.0  0.2  12536  1068 pts/1    S+   17:51   0:00  |                   \_ /home/vagrant/ctf/ASIS2014/reverse150/re_150
vagrant   4913  0.0  0.0  12536   172 pts/1    t+   17:52   0:00  |                   |   \_ /home/vagrant/ctf/ASIS2014/reverse150/re_150
Going into visual mode we can see that we are at the top of the sub.malloc_f9d function and that there’s a ton of local variables being allocated on the stack.
Now we can start debugging this function by for instance going into visual panels mode in r2 where we have a nice overview of what happens on the stack and to the registers.
:> V!
No comments :
Post a Comment